

Logistics AI
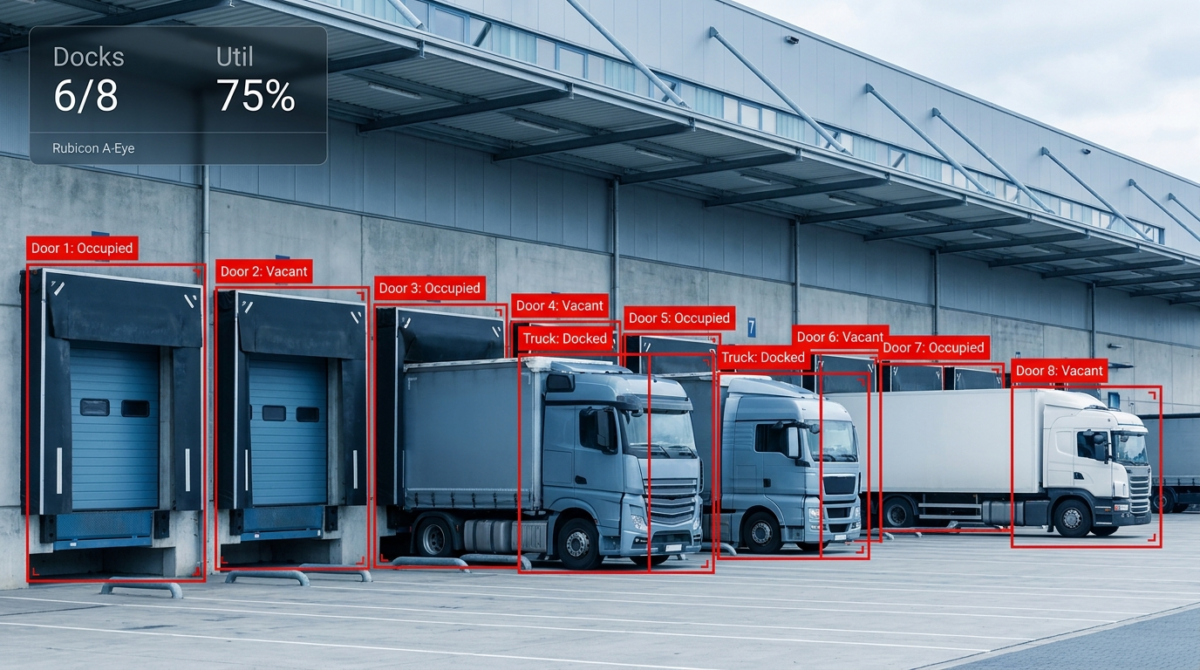
Most networks cannot say which docks across their sites are actually carrying the load and which sit idle. Rubicon A-Eye measures dock-door occupancy and turnaround time across every covered bay, so utilisation becomes a number you manage rather than a guess.
The business challenge
Dock doors are one of the most expensive constraints in a logistics network, yet most operations manage them by feel rather than by measurement. A scheduler knows roughly which docks tend to be busy and which tend to sit empty, but rarely has the data to say it with confidence across an entire facility, let alone across multiple sites. Without that data, capacity decisions — whether to add more doors, reassign carriers, or change scheduling windows — are made on assumption.
The deeper issue is that dock activity is fragmented across many individual bays, and no one is positioned to watch all of them continuously. A supervisor can see what is happening at the door in front of them, but not whether the door three bays down has been idle for the last forty minutes, or whether one carrier consistently turns around faster than another at the same dock.
For yard and dock schedulers, the recurring problems look like this:
- No reliable answer to which docks are actually busiest across the network
- Idle dock time that goes unnoticed because no one is watching every door
- Scheduling decisions based on assumption rather than measured turnaround
- Uneven load across docks, with some doors overworked and others underused
- Difficulty comparing utilisation across multiple sites consistently
- Capacity expansion considered before existing dock capacity is fully understood
The hidden cost of unmeasured dock capacity
Every dock door that sits idle while others are overloaded represents capacity that already exists but is not being used. Left unmeasured, this imbalance pushes operations toward adding more doors or more shifts to solve a problem that better scheduling against existing capacity could solve instead. The cost is not visible on any single day, but it compounds across a network: idle time on some doors, congestion on others, and capital spent on expansion that measured utilisation might have shown was unnecessary.
How Rubicon A-Eye solves the problem
A-Eye treats dock utilisation as a measurement problem across every covered bay simultaneously, not a spot-check at one door. Cameras over each monitored dock door feed an on-site edge device that determines occupancy state, turnaround duration and idle gaps for that bay continuously. Run across multiple docks — and multiple sites — this produces a utilisation picture at the network level that no single supervisor could maintain by walking the yard.
Processing runs on a small computer inside each facility, not in the cloud. Footage never leaves the site, which keeps you aligned with UAE data-privacy expectations and avoids the bandwidth cost of streaming video off-premise. The output — occupancy state, turnaround time, idle duration, per-dock and per-site — is what travels onward, straight into your scheduling and reporting systems.
This is a network-level capacity view, not a substitute for the detailed in-bay procedural monitoring covered separately under Warehouse AI loading bay monitoring. A-Eye’s dock utilisation measurement is about how hard each door works and how that compares across the whole estate of docks — allocation and capacity, not step-by-step bay procedure. Used this way, scheduling decisions shift from assumption to measured allocation across the docks you already have.
Key capabilities
Per-dock occupancy tracking
See which doors are occupied, idle or in transition in real time, across every covered bay simultaneously.
Turnaround-time measurement
Measure how long each dock spends in use per vehicle, comparable across doors, carriers and shifts.
Idle-gap detection
Identify the gaps between dock uses that quietly erode total network capacity over a day or week.
Cross-dock comparison
Compare utilisation across docks and sites to see where load is unevenly distributed.
Throughput-per-door metrics
Quantify what each individual dock actually processes over a shift, day or week.
Network-level capacity view
Roll utilisation data up across multiple sites to support estate-wide scheduling and expansion decisions.
What you can measure
Continuous per-dock measurement turns utilisation from an impression into operational data a scheduler can act on:
- Occupancy rate per dock door across shifts, days and sites
- Average and outlier turnaround time per dock, carrier and vehicle type
- Idle-gap duration and frequency between dock uses
- Load distribution across docks within a facility and across a network
- Throughput per door over comparable time windows
- Utilisation trends over time to support capacity-planning decisions
Industry applications
Dock utilisation measurement applies wherever multiple dock doors serve as a shared, constrained resource across a facility or network. In the UAE and wider GCC it is especially relevant for:
For multi-site networks, comparable utilisation data across facilities is the foundation for deciding where to invest in additional capacity and where existing docks are simply being scheduled poorly. For 3PLs managing client SLAs, measured turnaround time per dock supports both internal scheduling and external commitments. For cross-dock operations, where speed through the dock is the entire point of the model, idle-gap visibility is directly tied to throughput.
Business benefits
The value of measured dock utilisation is practical and immediate. Operations that adopt it typically gain:
- A clear, measured answer to which docks are busiest and which are underused
- Better-balanced scheduling across docks instead of uneven load
- Capacity decisions grounded in measured utilisation rather than assumption
- Earlier visibility into idle gaps that previously went unnoticed
- Consistent, comparable turnaround metrics across carriers and sites
- Stronger basis for evaluating whether to expand dock capacity or reschedule
- Improved ability to set realistic turnaround expectations with carriers
How it works: the operational workflow
The path from a camera frame to a scheduling decision is deliberately short. A-Eye is built so that what each dock door experiences becomes a comparable operational metric, not an isolated observation.
Example scenarios
Finding the consistently idle dock
A facility has assumed all its dock doors carry roughly equal load. Measured data shows one particular dock sits idle far more than the others across every shift. The scheduler starts directing more arrivals to that door, easing pressure on the busier docks without adding capacity.
Result: existing capacity rebalanced instead of assumed to be already optimal.
Comparing turnaround across sites
A network operating several distribution centres wants to know which site handles dock turnaround most efficiently before deciding where to route a new client’s volume. Comparable per-dock turnaround data across the sites gives a clear, measured basis for the decision.
Result: routing decision made on data instead of site reputation.
Identifying a carrier-specific delay pattern
Turnaround data shows that one carrier consistently takes longer at the dock than others using the same door and similar loads. The operations team raises this directly with the carrier, supported by measured turnaround comparisons rather than a general impression.
Result: a specific, addressable delay pattern identified instead of a vague complaint.
Reconsidering a capacity expansion
A facility manager has been planning to add two more dock doors to relieve congestion. Idle-gap data across the existing docks shows a significant amount of unused capacity sitting in scheduling gaps rather than a genuine shortage of doors. The expansion is paused while scheduling is adjusted first.
Result: a capital decision reconsidered based on measured utilisation rather than assumption.
Integration with your systems
Dock utilisation data delivers its value when it reaches the scheduling and planning systems your team already uses. As a certified Odoo partner and AI engineering team, Rubicon treats this integration as core to the solution rather than an afterthought.
| System | How A-Eye connects |
|---|---|
| Odoo ERP / Logistics & Scheduling | Per-dock occupancy and turnaround data feeds scheduling and capacity-planning records. |
| Transport management (TMS) | Measured turnaround and idle-gap data supports carrier scheduling and SLA tracking. |
| Dashboards | Live per-dock and network-level utilisation presented to schedulers and operations managers. |
| Reporting systems | Utilisation, turnaround and idle-gap trends exported for capacity-planning and management reporting. |
Understanding dock occupancy and turnaround metrics
Measuring dock utilisation accurately requires precision about what occupancy means. A dock is occupied from the moment a vehicle arrives at the bay until it departs. Turnaround time is the duration of that occupancy, including everything: trailer manoeuvring, door opening, goods transfer, paperwork and departure. This is a gross metric, not a net processing time, but it is the relevant number for capacity planning because that is how long the bay is unavailable to other vehicles.
In practice, detection works by monitoring the dock door itself: a camera positioned to see whether a vehicle is backed into the bay and attached to the door. The edge device then measures the duration continuously, and those measurements are aggregated per dock, per shift, per carrier and per vehicle type. This produces a rich dataset that can answer questions like “What is the average turnaround for incoming loads from Carrier X?” or “How much longer do outbound consolidations take compared to direct passthrough?
The accuracy of turnaround measurement depends on camera coverage of each individual bay. Unlike pallet counting or goods movement, where a single camera can cover a zone, dock utilisation requires a dedicated view of each door. This is almost always available because most facilities already have CCTV at the dock area for safety and security. During the site assessment, the team confirms that each dock-door zone has adequate coverage to detect presence reliably.
Capacity analysis and scheduling implications
The real operational value emerges when turnaround data is analysed across multiple docks and time periods. A utilisation report might show: “Docks 1-3 average 45 minutes per turnaround, while Dock 4 averages 28 minutes.” That difference signals either higher-capability loading equipment at Dock 4, or the types of loads sent there. Either way, it is actionable intelligence that lets a scheduler route new arrivals strategically rather than randomly.
Similarly, idle-gap data reveals hidden capacity loss. A dock that is theoretically available 16 hours per day but sits idle for 4 hours in scattered 15-minute gaps is effectively 75% utilised, not because it lacks work but because of scheduling fragmentation. Once visible, that gap can be addressed by consolidating scheduling windows or pre-positioning equipment ahead of known busy periods.
For multi-site networks, the comparison across sites is equally powerful. If one distribution centre turns around vehicles 20% faster than its peers for comparable loads, that becomes a benchmark to investigate. Is it staffing? Equipment? Layout? Once the metric is visible and comparable, the investigation can be targeted rather than speculative.
Planning capacity expansion and replacement decisions
The classic planning error is adding dock capacity without understanding whether the bottleneck is truly insufficient doors or poor scheduling against existing doors. Measured utilisation data provides the factual basis to distinguish these cases. If all docks are running above 70% utilisation consistently during your peak shift, capacity expansion is probably justified. If most docks are below 50% utilisation but peak-period queuing still occurs, the problem is scheduling, not capacity.
This distinction saves significant capital because dock expansion is expensive: it requires civil work, additional infrastructure and ongoing operational costs. A scheduler who is properly tooled to work with measured data can often relieve congestion through rebalancing before expansion becomes necessary.
Frequently asked questions
How is this different from loading bay monitoring?
Can it cover many docks at once?
Can it compare utilisation across multiple sites?
Do we need to install new cameras?
Where is footage processed and stored?
How is turnaround time measured?
Will it integrate with our existing Odoo or TMS setup?
How long does implementation take?
Does it tell us why a dock is idle, or just that it is?
Can it help decide whether to add more dock doors?
What does it cost?
See dock utilisation measured across a network like yours
Book a demo or a no-obligation site assessment and we will show A-Eye measuring utilisation against your docks and your Odoo.